Perfomanceanalysing with SAR
Installation
You need to install the package sysstat to use sar. You also need to configue a cronjob, so sar can collect all the great perfomance data. The package comes with the needed cron-configfiles for sar and safe them (depends on the distro) in /etc/sysstat/. Some distros safe the config-files in the directory /etc/cron.d/sysstat, so you don’t have to configure the cronjob. To find the config-files, you can use find /etc/ -name 'sysstat' -ls. Also you can take a look on the manuals.
Important: On Ubuntu or Debian you have to activate
sarin the config.
In the config-files you can also configure the retentiontime of the SAR-Files, the compression and some other behavior of sar.
Analysis
Let sar collect its data, could take some minutes, and you would see some performancedata. Here are some examples how you could use sar. With the parameter -s [ hh:mm:ss ] and -e [ hh:mm:ss ] you can look at a specific time.
sar -P ALL -f FILE cpu usage
1
2
3
4
5
6
7
8
[localhost ~]# sar -P ALL -f /var/log/sa/sa30
Linux 2.6.32-504.el6.x86_64 (localhost.localdomain.local)        08/30/2016      _x86_64_        (24 CPU)
12:00:01 AM     CPU     %user     %nice   %system   %iowait    %steal     %idle
12:10:01 AM     all      0.61      0.00      0.10      0.00      0.00     99.29
12:10:01 AM       0      1.24      0.00      0.13      0.01      0.00     98.62
12:10:01 AM       1      1.11      0.00      0.13      0.00      0.00     98.76
12:10:01 AM       2      0.39      0.00      0.04      0.00      0.00     99.57
12:10:01 AM       3      0.12      0.00      0.06      0.00      0.00     99.82
sar -r memory usage
1
2
3
4
5
6
7
[localhost ~]# sar -r
Linux 2.6.32-504.el6.x86_64 (localhost.localdomain.local)        09/21/2016      _x86_64_        (24 CPU)
12:00:01 AM kbmemfree kbmemused  %memused kbbuffers  kbcached  kbcommit   %commit
12:10:01 AM   1130288  64709056     98.28    409524   3259532  15275420     16.06
12:20:01 AM   1151944  64687400     98.25    409904   3268520  15035296     15.81
12:30:01 AM    986544  64852800     98.50    410628   3280868  15236812     16.02
12:40:01 AM   1119692  64719652     98.30    411084   3289328  15033256     15.80
sar -q load average
1
2
3
4
5
6
7
8
 sar -q
Linux 2.6.32-504.el6.x86_64 (localhost.localdomain.local)        09/21/2016      _x86_64_        (24 CPU)
12:00:01 AM   runq-sz  plist-sz   ldavg-1   ldavg-5  ldavg-15
12:10:01 AM         5      2406      3.83      4.10      4.01
12:20:01 AM         3      2374      5.01      4.33      4.06
12:30:01 AM         5      2382      5.68      5.36      4.76
12:40:01 AM         6      2374      4.86      5.09      4.90
12:50:01 AM         5      2366      3.95      4.89      4.97
sar -b I/O operations
1
2
3
4
5
6
7
8
sar -b
Linux 2.6.32-504.el6.x86_64 (localhost.localdomain.local)        09/21/2016      _x86_64_        (24 CPU)
12:00:01 AM       tps      rtps      wtps   bread/s   bwrtn/s
12:10:01 AM   3646.46   2977.13    669.33 1599307.18  57903.85
12:20:01 AM   3245.80   2819.17    426.63 2056453.53  16072.15
12:30:01 AM   3955.01   3574.09    380.92 2942349.39  15947.53
12:40:01 AM   3388.08   3058.67    329.40 2556103.25   9974.61
12:50:01 AM   3822.75   3439.04    383.71 2620442.12  18217.56
sar -n DEV networkstatistics
1
2
3
4
5
6
7
8
sar -n DEV
Linux 2.6.32-504.el6.x86_64 (localhost.localdomain.local)        09/21/2016      _x86_64_        (24 CPU)
12:00:01 AM     IFACE   rxpck/s   txpck/s    rxkB/s    txkB/s   rxcmp/s   txcmp/s  rxmcst/s
12:10:01 AM        lo    739.45    739.45    166.14    166.14      0.00      0.00      0.00
12:10:01 AM      eth0   1574.93   9841.77    255.60  13465.45      0.00      0.00      0.00
12:10:01 AM      eth1   1988.50   1632.92   1261.40    834.06      0.00      0.00      0.00
12:10:01 AM      eth2      0.00      0.00      0.00      0.00      0.00      0.00      0.00
12:10:01 AM      eth3      0.00      0.00      0.00      0.00      0.00      0.00      0.00
Human-Readable
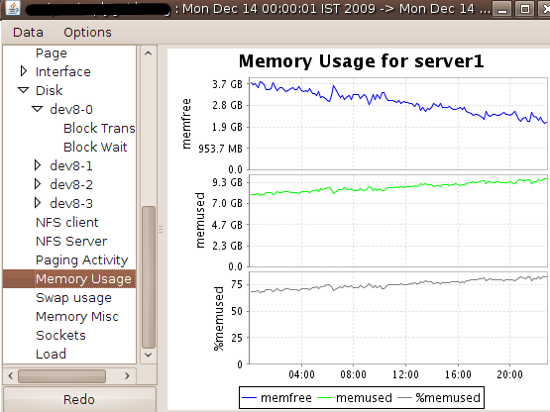
To get this a littlebit easier to read, you can use the little java-tool kSar. With this tool you can: - import sar-data, - look on graphs, - export to pdf To do this, you have to export the performancedata you wanne use. You can do that, with this little command: LC_ALL=C sar -A > /tmp/sar.data.txt LC_ALL=C changed the default language to a pretty format for kSar. Eventually kSar is not capable of your default language. 
